English
 German
 Hungarian
 Dutch
Dutch
 Spanish
 French
 Italian
 Czech
Czech
 Polish
 Greek
Greek
A crypto coin profit calculator answers one question: after electricity and the pool fee, does this hardware make money mining this coin today? MinerCompare runs a dedicated mining profit calculator for every mineable coin, fed by live network and price data. This guide explains exactly what the calculator computes and from which inputs, where the numbers come from and how often they refresh, how to use it step by step, how to read the result without fooling yourself, and which mistakes turn a good crypto calculator into a bad decision.
What a crypto coin profit calculator computes
The whole calculation is five inputs and one subtraction. You give it your hashrate with its unit, your power draw in watts, your electricity rate in your currency, and the fee your pool charges. The network gives it the rest: network hashrate or difficulty, block time, block reward and the coin price. From those it works out how many coins your share of the network mines in a day, what they are worth, what the electricity costs, and what is left.
Income comes from your share of the network. Your hashrate divided by the network hashrate is the fraction of all blocks you can expect to find. Multiply that by the number of blocks the chain produces per day, which is the seconds in a day divided by the block time, and by the block reward, and you have your coins per day. Multiply by the coin price and you have gross income in US dollars, which the calculator converts to your display currency.
Cost comes from your side of the wall socket. Power in kilowatts times twenty-four hours times your rate per kilowatt-hour is your daily electricity bill, already in your currency. The pool fee is a percentage of the coins mined, so it scales with income and not with power. Profit per day is income minus pool fee minus electricity, and the monthly and yearly figures are that number times the days in the period.
| Output | How it is calculated |
|---|---|
| Coins per day | Your network share times blocks per day times the block reward |
| Income per day | Coins per day times the coin price, converted to your currency |
| Electricity per day | Kilowatts times 24 hours times your rate per kilowatt-hour |
| Pool fee per day | Coins per day times the fee percentage, valued at the coin price |
| Profit per day | Income minus pool fee minus electricity |
| Network share | Your hashrate divided by the network hashrate |
| Break-even electricity | Income per day divided by the kilowatt-hours you burn in a day |
The difficulty formula is the same answer from a different input. When a network publishes difficulty rather than hashrate, the calculator uses the fixed relationship between difficulty and the expected number of hashes per block: your hashrate times the block reward times the seconds in a day, divided by difficulty times two to the power of thirty-two. The coin page lets you switch between Network and Difficulty mode; on a fresh data set they agree, and when they disagree the data is stale on one side.
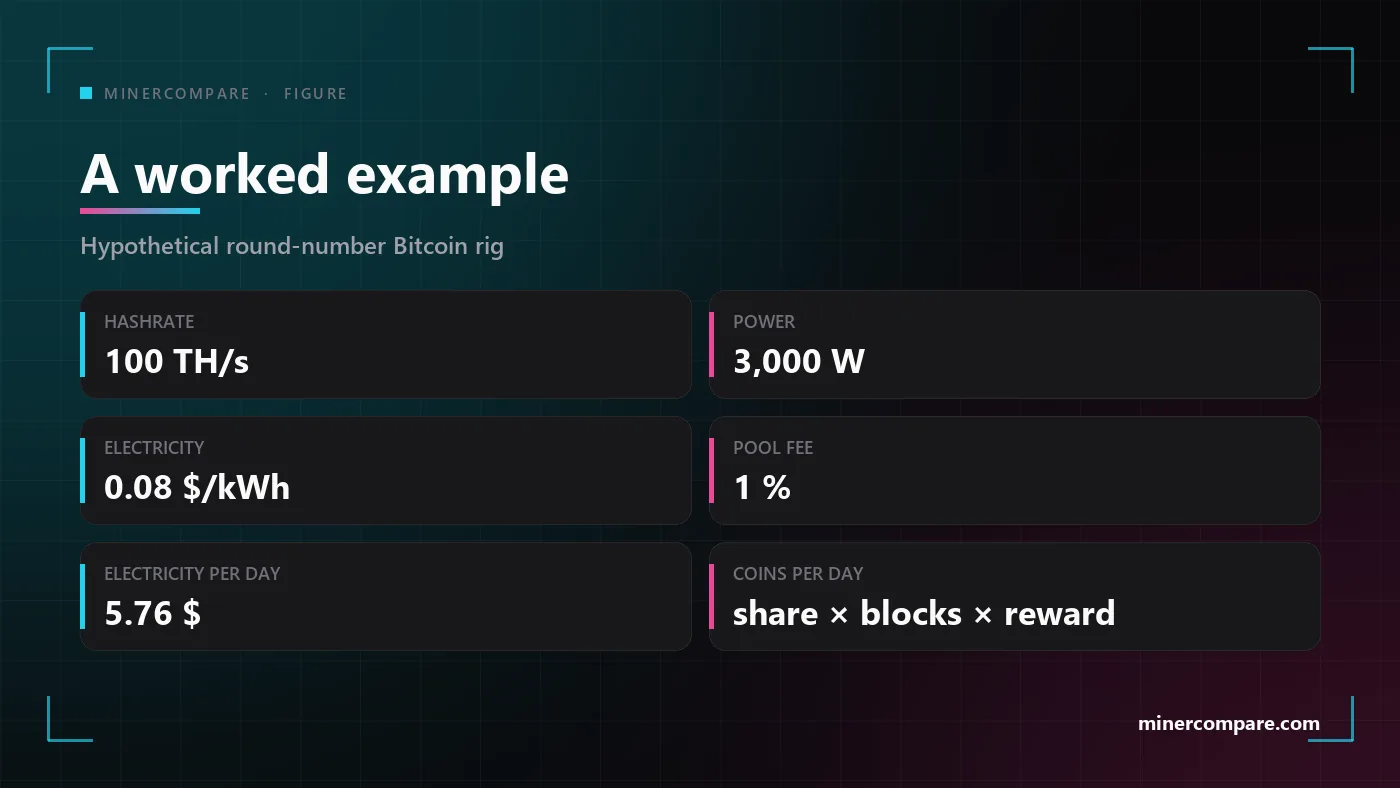
Take a round hypothetical machine to see the shape of the maths. Suppose a Bitcoin miner with the hashrate, power and electricity rate in the figure above. The electricity side is fixed arithmetic: three kilowatts for twenty-four hours at eight cents is a daily bill the calculator can state to the cent before it knows anything about the network. The income side needs the live network hashrate and price, and both change every hour, so no article can print that half honestly; the calculator can.
Where the live data comes from
Every number the calculator did not get from you is refreshed on a schedule. Coin prices, network hashrate, difficulty, block time and block reward for every mineable coin come from the coin data feed once an hour. Currency rates for the display currency and the kilowatt-hour rate come from a market data API every ten minutes. Algorithm incomes, including the NiceHash marketplace rate that the ASIC and GPU lists use, refresh every ten minutes as well, and the Bitcoin difficulty, next adjustment and epoch progress come from the mempool data every ten minutes.
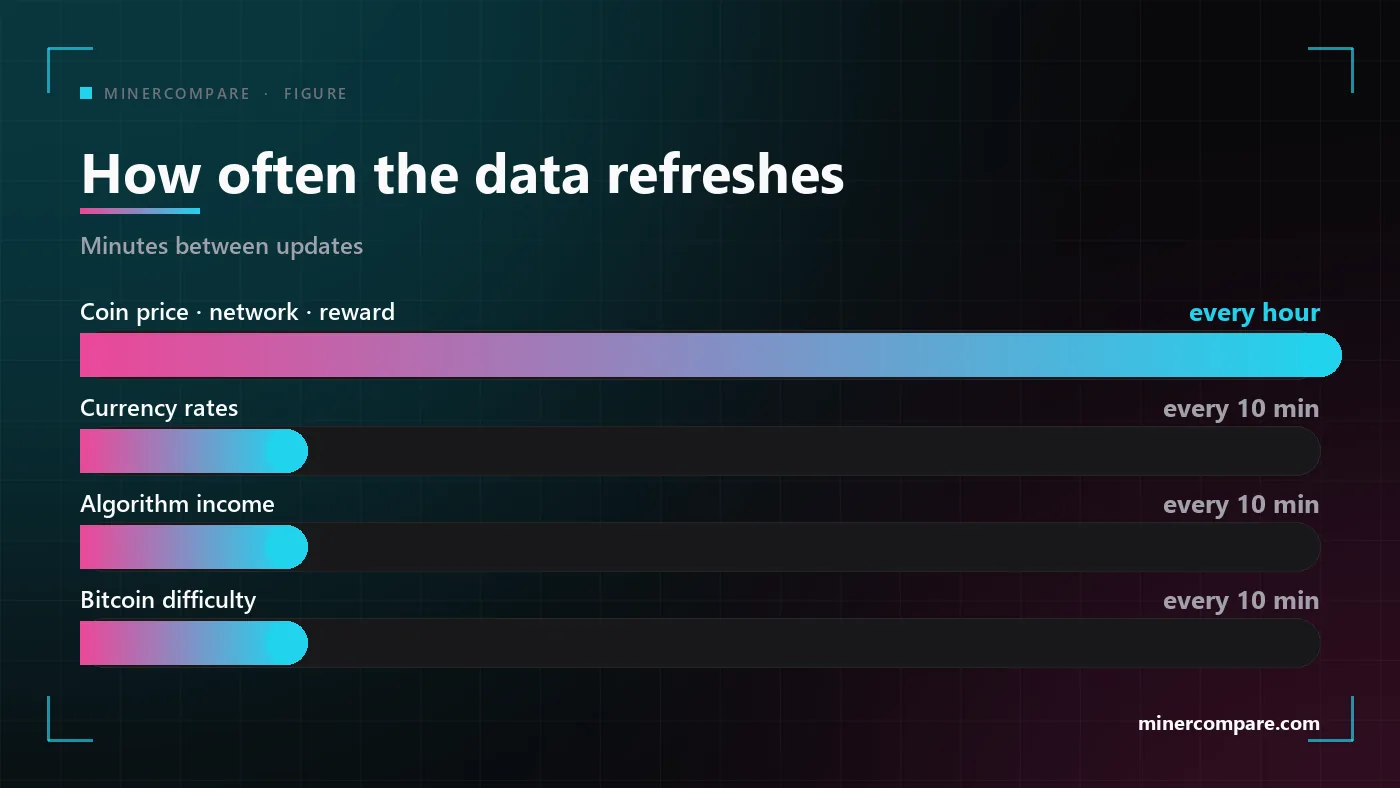
The result is not cached; it is recomputed when the page loads. Your inputs, your rate and your currency are combined with the latest stored network values at render time, which is why two visitors with different electricity rates see different profit on the same coin page and why the same rig shows the same profit on the coin page, the ASIC list and the miner page. Every page on the site uses one calculation layer, so there is no page that quietly disagrees with another.
How to use the crypto profit calculator
Six steps, two of which most people skip. The calculator works with its defaults, which is convenient and also the reason so many people trust a result that was never about their hardware. Walk the steps below once per rig and the number on the screen is yours.
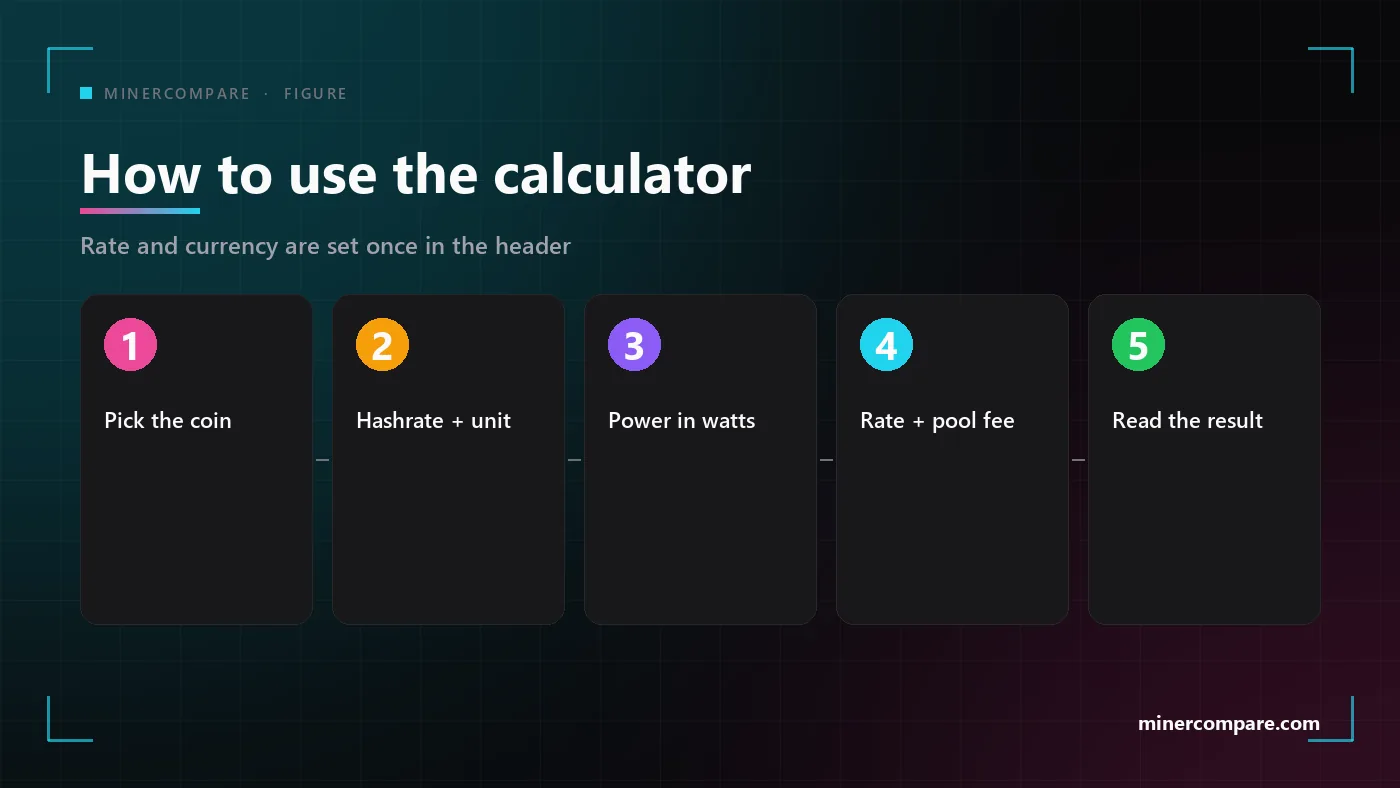
Open the calculator for your coin
Start from the coin list and pick the coin your hardware mines. Each coin page is pre-filled with a typical rig for that algorithm, so you see a working result before you type anything.
Enter your hashrate and pick the unit
Type the hashrate from your miner dashboard, not the box, and choose the matching unit from the dropdown. Bitcoin hardware works in TH/s, Scrypt in GH/s or MH/s, Zcash in kSol/s and Monero in kH/s.
Enter the power draw in watts
Use the wall reading or the manufacturer figure for your mode. Power is the only input that costs you money every hour, so a wrong number here moves the profit line more than any other.
Set your electricity rate and currency
Both live in the header and apply to every page on the site. Use the all-in price from your bill, taxes and network charges included, and the currency you actually pay in.
Add the pool fee
Enter the percentage your pool charges. It is taken from the coins you mine, so it scales with income, not with power. Leave it at zero only if you are mining solo.
Read profit per day, month and year
Switch the period to see the same result over a month or a year, switch the display to see it in coins instead of currency, and check the network share and break-even lines below the result.
Every mineable coin with its own calculator, live price, network hashrate and difficulty, and the algorithm it belongs to. Pick your coin and the page is pre-filled with a typical rig.
Open the coin calculatorsHow to read the results
Read the profit line last. The headline number is the one everybody looks at and the one that tells you least on its own. Start with coins per day, because that is the physical output of your hardware and the only figure that does not depend on the price. Then look at income and electricity side by side, because their ratio tells you how much room you have before a price drop or a difficulty rise turns the row red.
- Coins per day. The output of your hashrate against the current network. If this number looks wrong, the hashrate unit is wrong.
- Income versus electricity. A rig earning twice its power cost survives a halving; a rig earning ten percent more than its power cost does not survive a bad week.
- Network share. Your fraction of the network, and the inverse of how long a solo block would take. Below the results on every coin page.
- Break-even price and break-even electricity. The coin price at which profit is zero at your rate, and the rate at which it is zero at the current price. These two lines are the honest summary of your margin.
- The difficulty stress test. What the same rig earns if the network grows by a given share while price and your rate stay fixed. This is what next month probably looks like.
The colour of the profit figure follows fixed thresholds. The same five colour bands are used on the coin page, the ASIC list and the GPU list, from deep red for a loss through to light green for a comfortable margin, so a glance at any table on the site tells you the same thing. The thresholds do not move with the market, which is deliberate: the colour is about your margin, not about how this week compares with last week.
A profit calculator is not a forecast. It is a precise statement about today, and the two lines that matter most are the ones that tell you how far today can move before the number changes sign.
Mistakes that make a crypto calculator lie
The calculator is only as honest as its inputs, and four inputs are wrong more often than not. None of these is a bug. Each is a number that looks plausible on the screen and is off by a factor the calculator has no way of knowing.
The wrong hashrate unit
Each step in the unit dropdown is a factor of a thousand, so a Scrypt miner entered in GH/s when the dashboard says MH/s shows a thousand times the real income. Zcash hardware reports solutions per second, not hashes, and the Zcash calculator expects kSol/s for that reason. If coins per day looks absurd in either direction, fix the unit before anything else.
Forgetting the pool fee
A pool fee left at zero overstates income by the fee, which is small on a strongly profitable rig and the whole margin on a marginal one. Enter what your pool actually charges, and remember that a payout threshold you will not reach for months is a fee of its own. The pools guide explains the payout schemes and what each one costs you. Crypto Mining Pools Explained
Power-supply losses and the number on the box
The manufacturer figure is the draw of the hashboards at a reference temperature; the number your meter reads includes the power supply, which loses a few percent as heat, plus fans working harder in a warm room. Measure at the wall if you can. If you cannot, add the power-supply loss to the spec figure rather than hoping it is already included.
Treating today as the whole year
The yearly figure is the daily figure multiplied by the days in a year, at today's difficulty and price. Network hashrate on every major chain grows over a year, which means your share shrinks even if your hardware does not change. Use the stress test on the coin page to see what a given growth does to the same rig, and read the yearly line as a ceiling, not a plan.
Difficulty growth and halvings
Two things change the income half of the calculation without you touching anything. Difficulty, or equivalently network hashrate, decides how big your share is; the block reward decides how much that share is worth in coins. The first moves continuously as miners join and leave, the second moves in steps that are written into the protocol.
Difficulty growth is a slow leak in your share. When more hashrate joins the network, the chain adjusts difficulty so blocks keep arriving at the same pace, and your fixed hashrate becomes a smaller fraction of the total. Your coins per day fall by exactly the growth of the network. This is why a calculator result from last quarter is already wrong, and why the stress test exists.
A halving is a step, and the Simulate Halving switch shows it. Bitcoin, Litecoin, Zcash and Nervos cut their block reward on a schedule; Kaspa reduces its emission monthly, Ethereum Classic drops its reward by a fifth every five million blocks, and Monero and Dogecoin do not reduce at all. Each coin calculator handles its own schedule, and on the coins that halve, the switch applies the next cut to the current result so you can see whether your rig survives it at today's price.
| Coin | Reward schedule | Calculator |
|---|---|---|
| Bitcoin (BTC) | Halves every four years | Simulate Halving |
| Litecoin (LTC) | Halves every four years | Simulate Halving |
| Zcash (ZEC) | Halves every four years | Simulate Halving |
| Kaspa (KAS) | Reduces every month | Emission schedule |
| Ethereum Classic (ETC) | Drops by a fifth every five million blocks | Reward toggle |
| Monero (XMR) | Tail emission, never halves | — |
| Dogecoin (DOGE) | Fixed reward, never halves | — |
The best dedicated coin calculators
Every coin has its own page, and three of them do most of the work. The Bitcoin calculator is the reference for ASIC hardware, the Zcash calculator covers the machines leading the profit table this season, and the Monero calculator is the one for CPUs. Each page carries the inputs and outputs described above plus the content that only makes sense for that coin: the halving simulator, the emission schedule or the tail-emission explanation.
 Bitcoin
SHA-256
Bitcoin
SHA-256
 Zcash
Equihash
Zcash
Equihash
 Monero
RandomX
Monero
RandomX
More calculators
The same calculator runs for every other mineable coin, each pre-filled with a typical rig for its algorithm and carrying its own network and reward notes.
When you do not have the hardware yet, start from the hardware lists instead. The ASIC list ranks every machine by what it earns on its own algorithm at your rate, and the algorithm pages narrow it to one coin family so you compare like with like. ASIC miners ranked by profit · Bitcoin SHA-256 miners · Litecoin and Dogecoin Scrypt miners · Zcash Equihash miners · Monero RandomX miners · GPU calculator
The most profitable ASIC miners right now
This table is live. It is computed when the page loads from the same data and the same income choice as the ASIC list: every machine on its own algorithm, at the electricity rate and currency set in the header. Change your rate in the header and the order and the figures follow. Solo lottery miners are left out on purpose, because a profit ranking is the wrong way to judge them.
| Rank | Miner | Algorithm | Power | Profit/day |
|---|---|---|---|---|
| 1 | Bitmain Antminer Z15 Pro Zcash Miner Z15 Pro 840KSol | Equihash 840kSol/s | 2780W | $56.54 |
| 2 | Pinecone Matches Inibox R1X XMR Edition (1.2MH) | RandomX 1.2MH/s | 2055W | $44.48 |
| 3 | Bitmain Antminer X9 1MH | RandomX 1MH/s | 2472W | $35.61 |
| 4 | Bitmain Antminer Z15K (525KH) | Equihash 525kSol/s | 2483W | $33.91 |
| 5 | Bitmain Antminer Z15 | Equihash 420kSol/s | 1510W | $28.04 |
Profit is the algorithm income minus electricity at the rate shown, before pool fees. The colour of the last column follows the same thresholds as the ASIC table. ASIC miners ranked by profit →
Open any machine for its full profile, every coin it can mine with the calculator result for each, vendor offers and the payback estimate at your rate.
Pool mining vs solo mining
The calculator assumes you mine in a pool, and for almost everyone that is right. A pool combines thousands of machines, finds blocks regularly and pays each member its share, so your income arrives as a smooth daily stream close to the expected value the calculator shows, minus the fee. Mining solo means keeping the whole block when you find one and nothing until then, and for a single machine on a large network that wait is measured in years.
If you came here with a single card rather than an ASIC, or you want the same calculator on your phone, these are the next reads; and the solo guide is the other half of the picture for the small Bitcoin miners. Best GPU for mining crypto in 2026 · The MinerCompare app for iOS and Android · Bitcoin home mining with solo lottery miners · Solo lottery mining with live odds · Compare two miners
Bottom line
Enter dashboard numbers, your real rate and your real fee, then read the margin lines before the profit line. Do that and the crypto coin profit calculator tells you the truth about today for your hardware on your coin, in your currency. It refreshes its network data every hour and its prices every ten minutes, so come back before you buy, before you move, and after every difficulty jump.
The three featured calculators cover ASIC Bitcoin mining, the Equihash machines leading the table and CPU mining on Monero; the lists cover the hardware you do not own yet; and the solo pages cover the one kind of miner where the right question is not how much, but how likely.