English
 German
 Hungarian
 Dutch
Dutch
 Spanish
 French
 Italian
 Czech
Czech
 Polish
 Greek
Greek
Compare 21energy Ofen 3 Base vs MicroBT WhatsMiner M7AS+
Read more Read less
Detailed comparison between 21energy Ofen 3 Base and MicroBT WhatsMiner M7AS+. Compare hashrate, power consumption, profitability, and technical specifications.
Quick comparison: 21energy Ofen 3 Base vs MicroBT WhatsMiner M7AS+. Daily profits: $-0.31 vs $7.40.
Miner Comparison Results
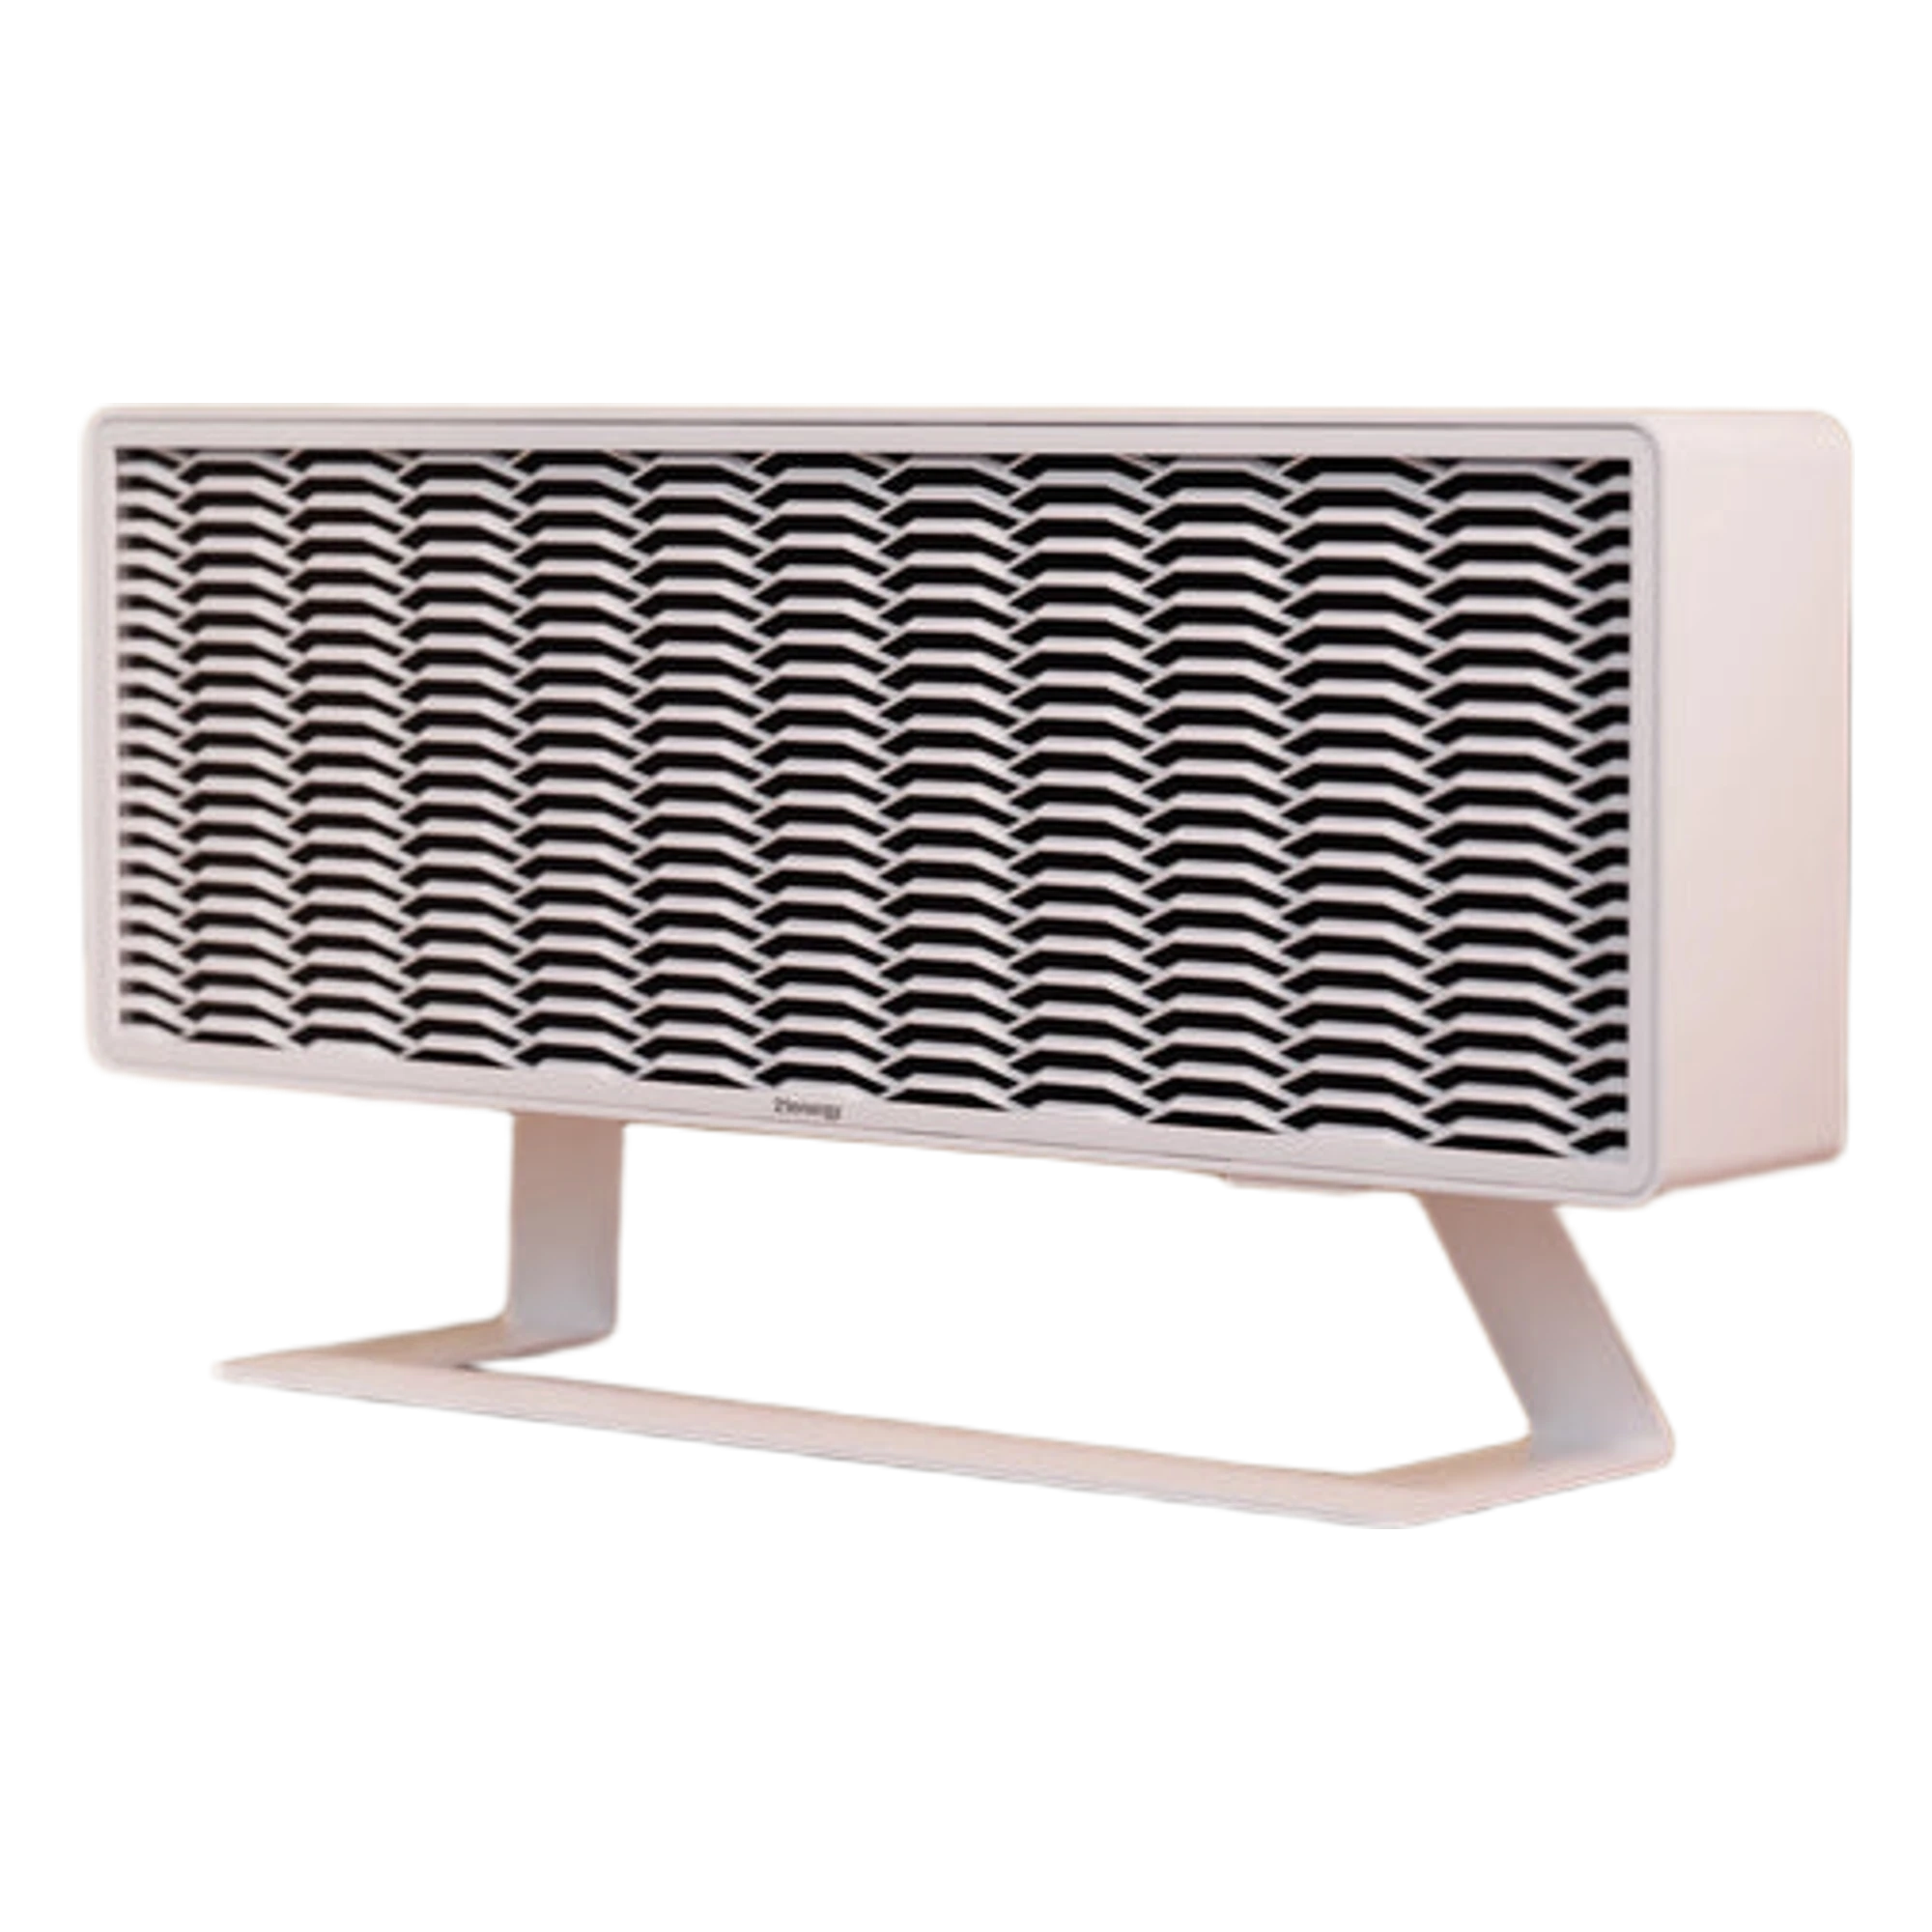
21energy Ofen 3 Base
SHA-256 • October 2026
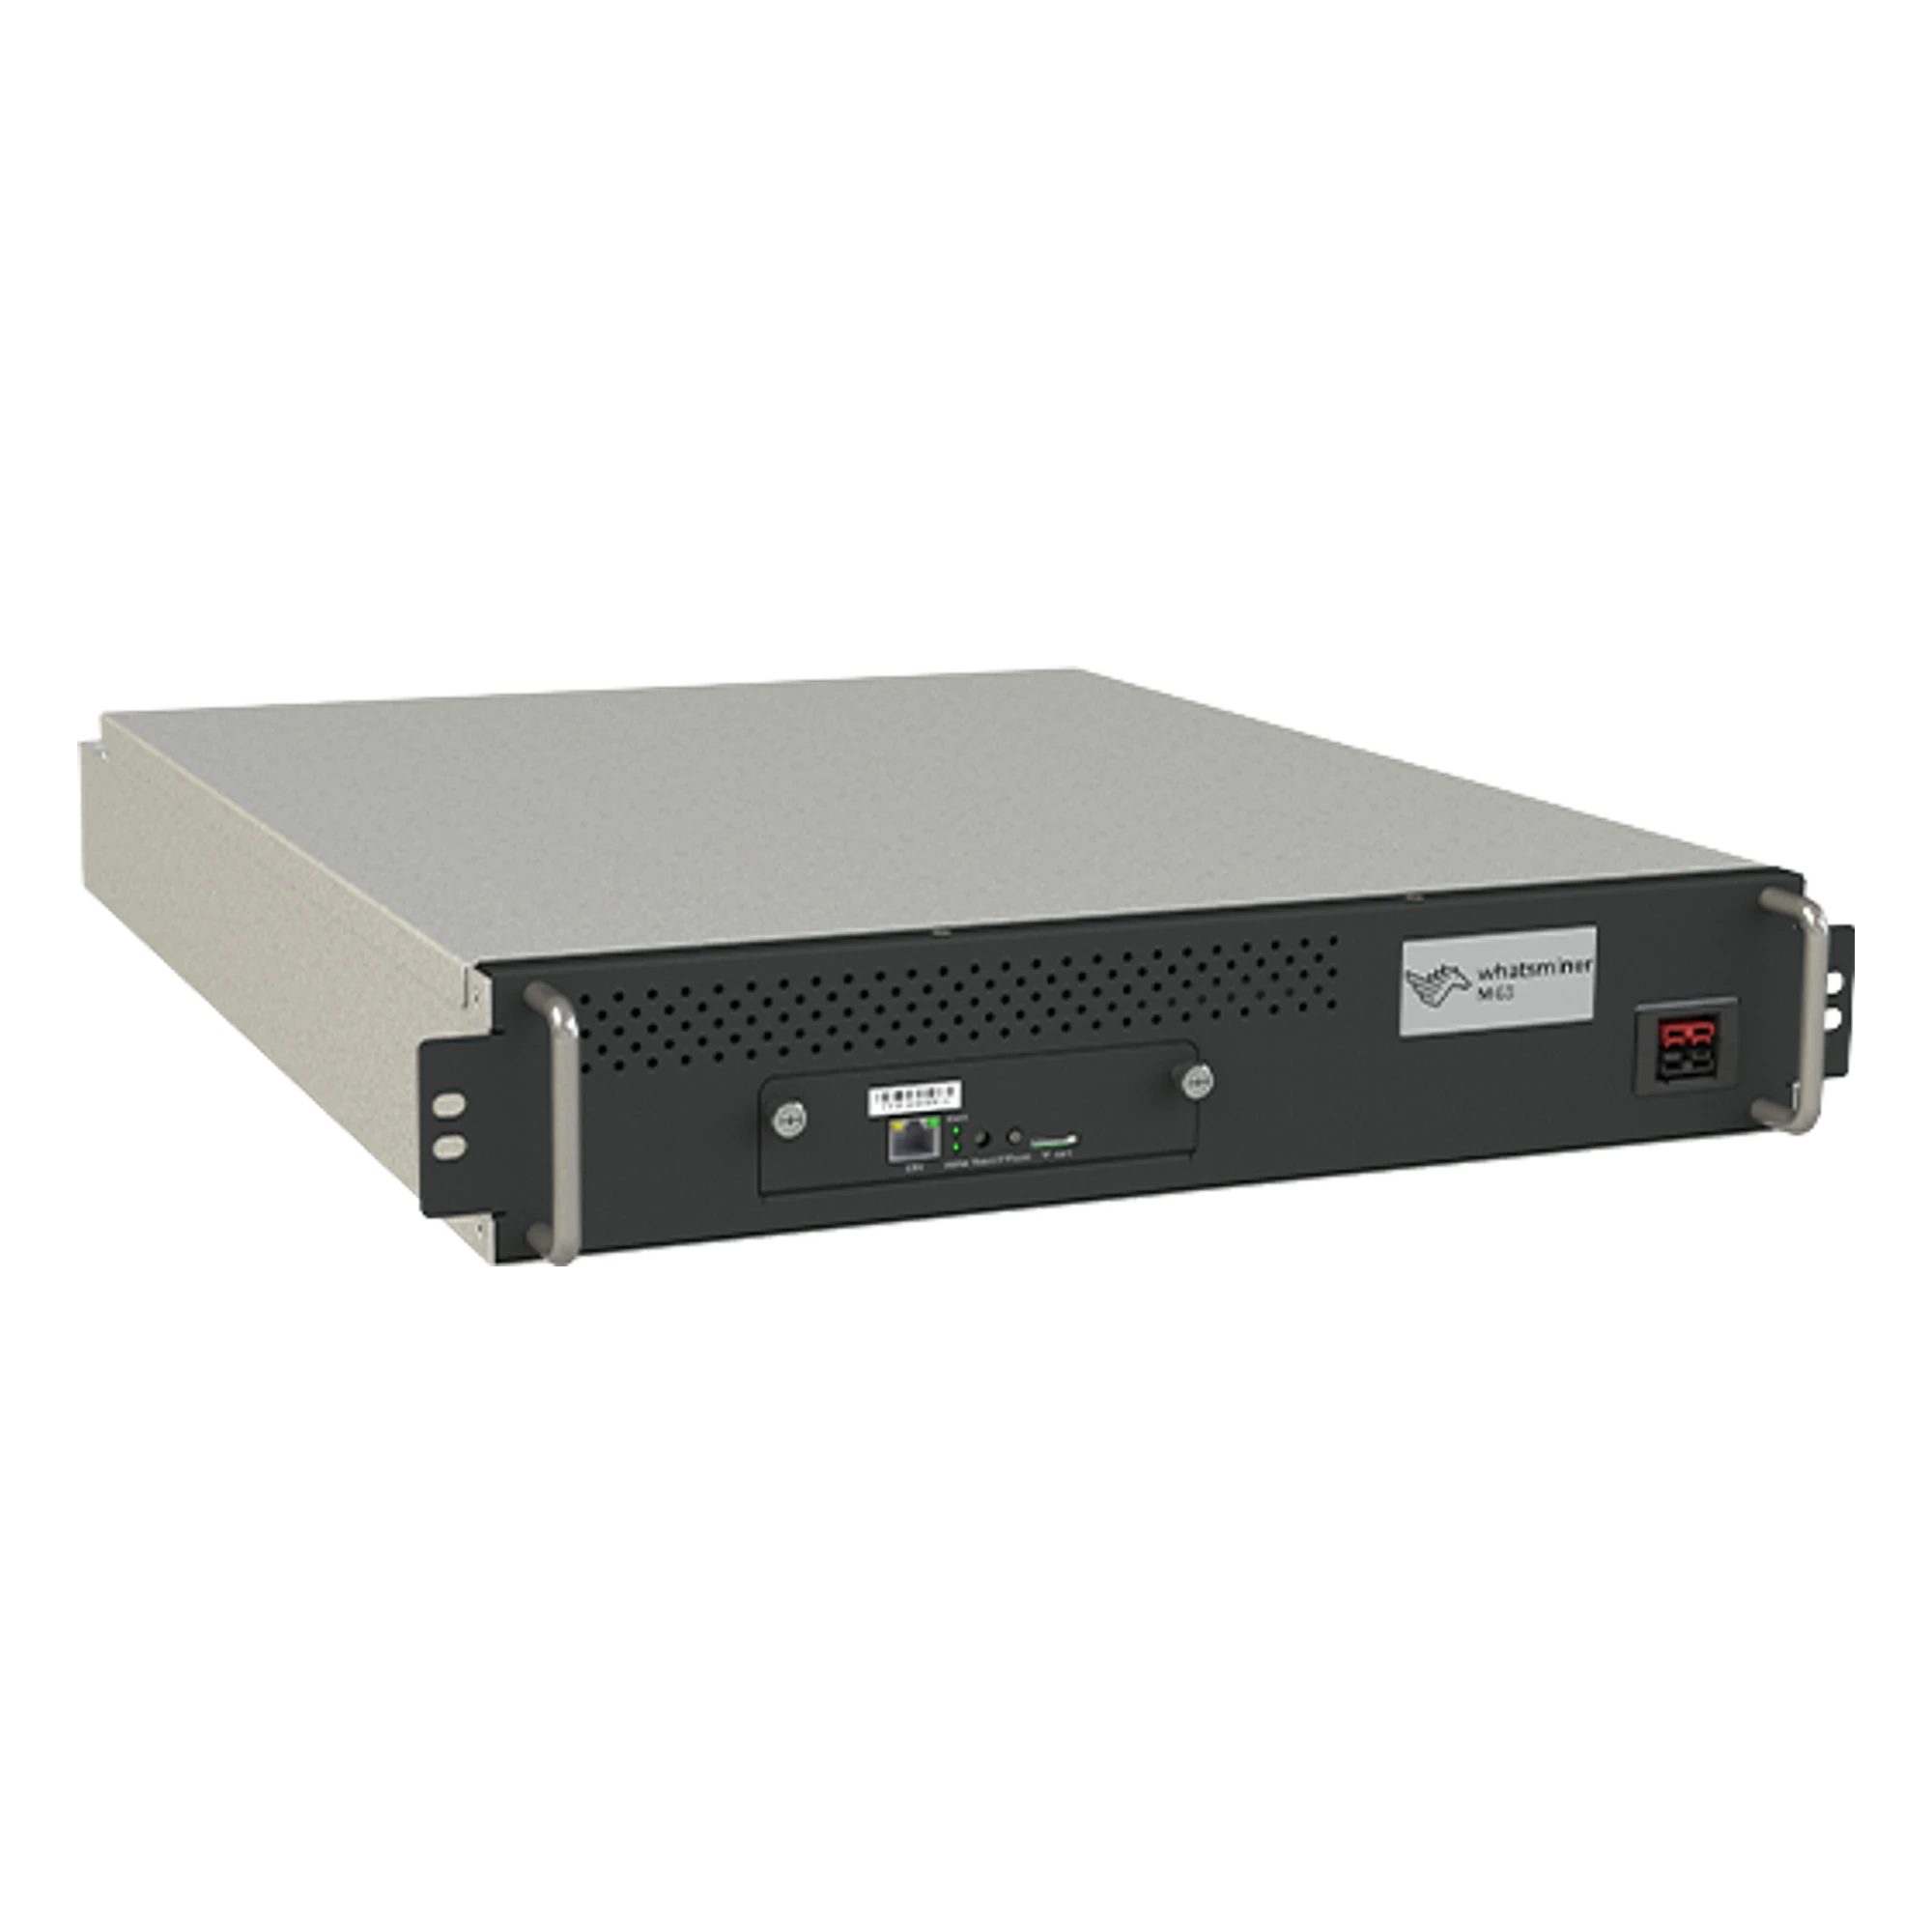
MicroBT WhatsMiner M7AS+
SHA-256 • November 2026
Profitability Comparison
Daily Profit
Monthly Profit
Yearly Profit
Technical Specifications
21energy Ofen 3 Base
MicroBT WhatsMiner M7AS+
Profit Analysis
A detailed comparison of the daily, monthly, and yearly profitability between the two selected ASIC miners, highlighting which offers the better return on investment.
The MicroBT WhatsMiner M7AS+ delivers superior daily profit of $7.40 versus $-0.31 from the 21energy Ofen 3 Base. With current electricity rates, the MicroBT WhatsMiner M7AS+ provides better return on investment through more efficient power consumption relative to its mining output. The MicroBT WhatsMiner M7AS+ consumes 7500W versus 1000W for the 21energy Ofen 3 Base, resulting in $12.48 higher daily electricity expenses. This power difference becomes particularly important for large-scale mining operations where every watt counts toward overall facility efficiency and cooling requirements.
Frequently Asked Questions
Everything you need to know
Hardware Comparison
A side-by-side breakdown of key hardware specifications to evaluate performance, efficiency, and overall value of the two selected ASIC miners.
Release timeline shows the 21energy Ofen 3 Base launched in October 2026 while the MicroBT WhatsMiner M7AS+ entered the market in November 2026. Newer miners typically incorporate improved chip architecture and manufacturing processes, leading to better efficiency and performance characteristics. Physical dimensions comparison reveals the 21energy Ofen 3 Base measures 900 x 320 x 140mm while the MicroBT WhatsMiner M7AS+ has dimensions of 483 x 86 x 663mm. Size considerations directly impact rack density, shipping costs, and facility space requirements for mining operations. Weight specifications show the 21energy Ofen 3 Base at 17000g compared to 29000g for the MicroBT WhatsMiner M7AS+. Heavier units often indicate more robust construction and heat dissipation components but may require stronger mounting solutions and increase shipping expenses. Acoustic performance differs with the 21energy Ofen 3 Base operating at 35db versus 35db for the MicroBT WhatsMiner M7AS+. Noise levels significantly impact placement options, with quieter units suitable for residential or office environments while louder miners require dedicated facilities with proper sound isolation. Humidity specifications indicate the 21energy Ofen 3 Base operates within 5 - 95 % conditions compared to 5 - 85 % for the MicroBT WhatsMiner M7AS+. Better humidity tolerance enables deployment in more diverse geographic locations and reduces the need for expensive climate control systems in mining facilities.
Why Choose Our ASIC Miner Comparison Platform
Get the most accurate, transparent, and data-driven insights to choose the best mining hardware for your goals.
Real-Time Market Data
Our system pulls live pricing and profitability metrics to keep comparisons accurate and relevant.
Transparent Performance Metrics
Compare hashrate, efficiency, and ROI side-by-side without hidden data or biased rankings.
Clean & Intuitive Interface
Our comparison dashboard is designed for clarity — quickly find what matters most without the clutter.
Expert-Backed Analysis
Each comparison is verified by experienced mining professionals to help you make the most profitable choice.
Built for Miners, by Miners
Our mission is to simplify ASIC miner research with real data, transparent comparisons, and professional insights — helping you save time, reduce risk, and maximize profitability.
Compare ASIC Miners
Discover why our platform is the most reliable and transparent way to compare ASIC miners for maximum profitability.
Choosing our ASIC miner comparison platform gives you a clear advantage in navigating the complex and fast-changing world of crypto mining. We provide the most accurate, data-driven insights sourced directly from manufacturers and real-time market conditions, ensuring you always have access to up-to-date profitability, efficiency, and cost metrics. Our comparison tools let you easily evaluate hashrate, power consumption, ROI, and break-even periods, helping you identify which miner best fits your budget and long-term goals. Whether you’re a first-time buyer or an experienced investor managing a large-scale operation, our transparent and easy-to-use platform helps you make smarter, faster, and more profitable decisions.
Key Insights
Quick highlights comparing the performance and features of the selected ASIC miners.
The MicroBT WhatsMiner M7AS+ generates $7.70 more daily profit than the 21energy Ofen 3 Base.
The MicroBT WhatsMiner M7AS+ generates $20.19 more daily income than the 21energy Ofen 3 Base.
The 21energy Ofen 3 Base consumes 86.7% less power, making it more energy efficient.
Both miners use the SHA-256 algorithm, targeting the same cryptocurrencies.
The miners use different cooling systems: Air vs Hydro.
Both the 21energy Ofen 3 Base and MicroBT WhatsMiner M7AS+ have identical noise levels of 35db.
The 21energy Ofen 3 Base is 41.4% lighter than the other miner.
Mining profitability in your pocket
Every ASIC miner, GPU and coin from the site, with live profit, ROI and your own electricity rate — free, no account needed, on iOS and Android.